OBDII, where it all comes together ...

Mitsubishi Outlander PHEV Forum

Help Support Mitsubishi Outlander PHEV Forum:

This site may earn a commission from merchant affiliate links, including eBay, Amazon, and others.
gwatpe said:
The pics posted on the forum will need to be carefully selected... .

And posted here:

http://www.myoutlanderphev.com/forum/viewtopic.php?f=10&t=1278

So we do not lose them and can be found easily.

Why?

The name says it all. "Technical graphs and images"

Regards Trex.
 
I was still looking at ways to visualise that the performance of the car is hardly affected by low SOC. Using plot.ly graphing service, I managed to present some of the data of last weekend, when I did some intermediate sprints accelerating from 50 or 70 km/h to 90 km/h, while towing the caravan. First picture shows a total system output of > 109 kW at 24.5% SOC:

low%20SOC%201_zpslhn55ahf.jpg


Second picture shows battery output of > 63 kW at 23.5% SOC:

low%20SOC%202_zpsa1cbhzou.jpg


Last picture shows that it wasn't just one or two sprints with low SOC, but several :mrgreen: :

low%20SOC%203_zpsieu8nl97.jpg
 
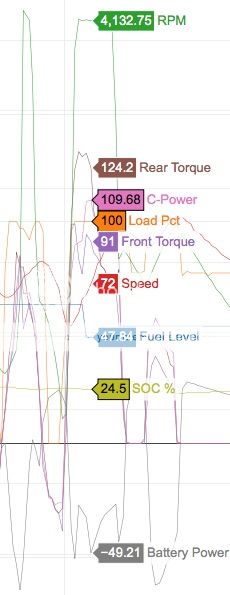
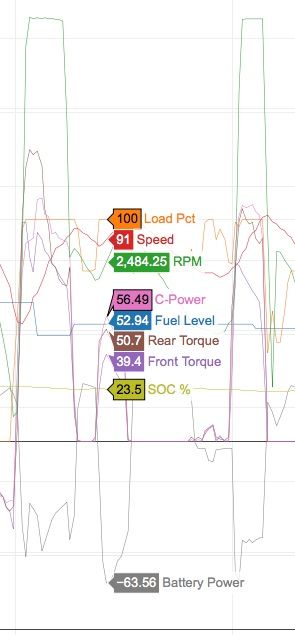
I must just be getting old, but am finding we can be overwhelmed with the spaghetti lines with many graphs combined with pastel screen colours for the lines.

I think that there is a place for a visual impact, but when we are trying to make a point, we have to be able to show just enough information.

I do appreciate that this is early days in discussions with data presentation, and that we have until recently only had MMC published data. Some sort of standards may need to be used to help less technical readers get some value from our efforts.

I have resorted to making my own graphing tools, that suit my needs. Still refining my program to make it easier for others to interpret the pics with less descriptions.

We have a long way to go on a relatively steep learning curve.

here is an example of an unambiguous plot of ice and EV operation with the spike of 100%power clearly shown, with the speed and petrol consumption. Just need some battery data to make things even clearer.

testpng.png


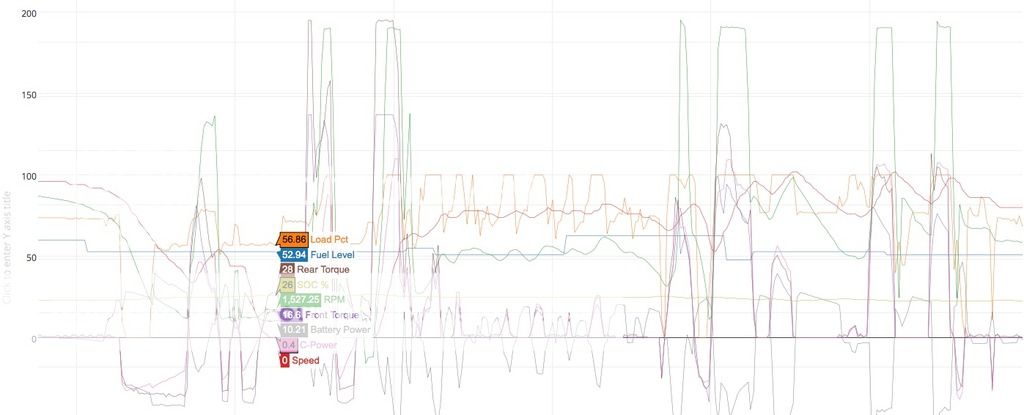
notice that in parallel hybrid operation, rpm and sped correlate as expected and the petrol consumption follows the load.
 
See what you are saying there, but my message was about the values in the labels, rather than the graphs themselves. I could have represented (some of) the numbers by themselves, but by showing them in the graph I got them from, I was hoping to add some credibility to the numbers, knowing that there are people out there who are convinced that the performance / drivability of the car is noticeably impacted by low SOC.
 
Depends what you mean by impacted. I find that under load with low SOC transition from serial to parallel can be slow and very noisy at best. I try and avoid it as much as possible.
 
Sorry, I meant getting up sufficient speed to switch over from serial to parallel drive. This is especially noticeable going up hill from stationary (I seem to come across a lot of hill start locations) but in slow moving traffic up hills can cause racing. I remember seeing one couple look shocked at the car as I went past, such was the noise. Naturally this is compounded when towing.
 
Back
Top