Trex
Well-known member
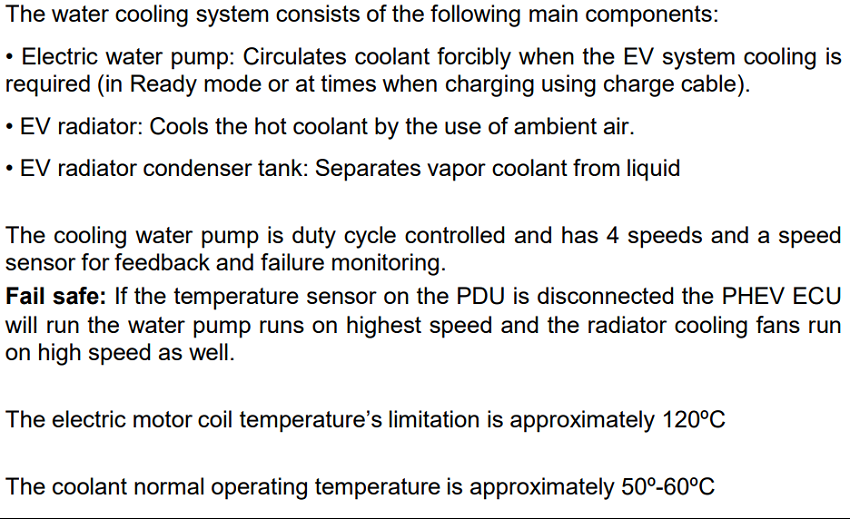
Hi,
Hope this works so here goes.
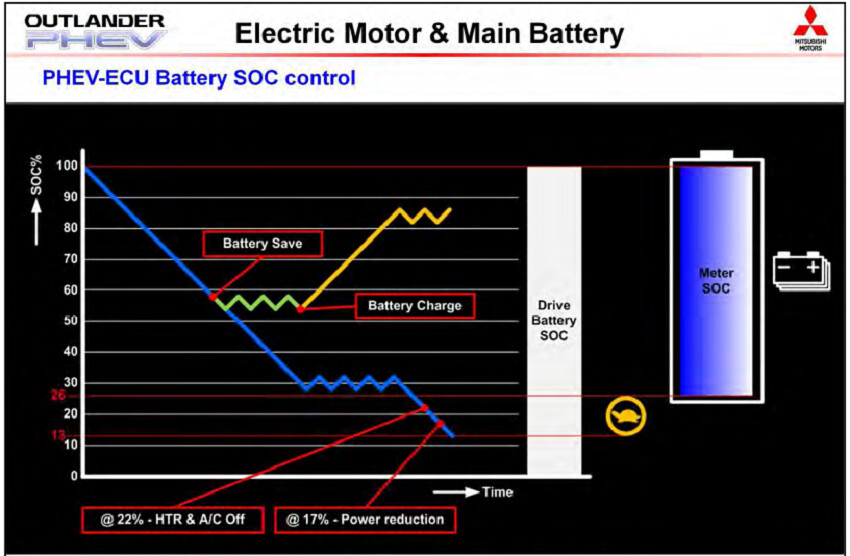
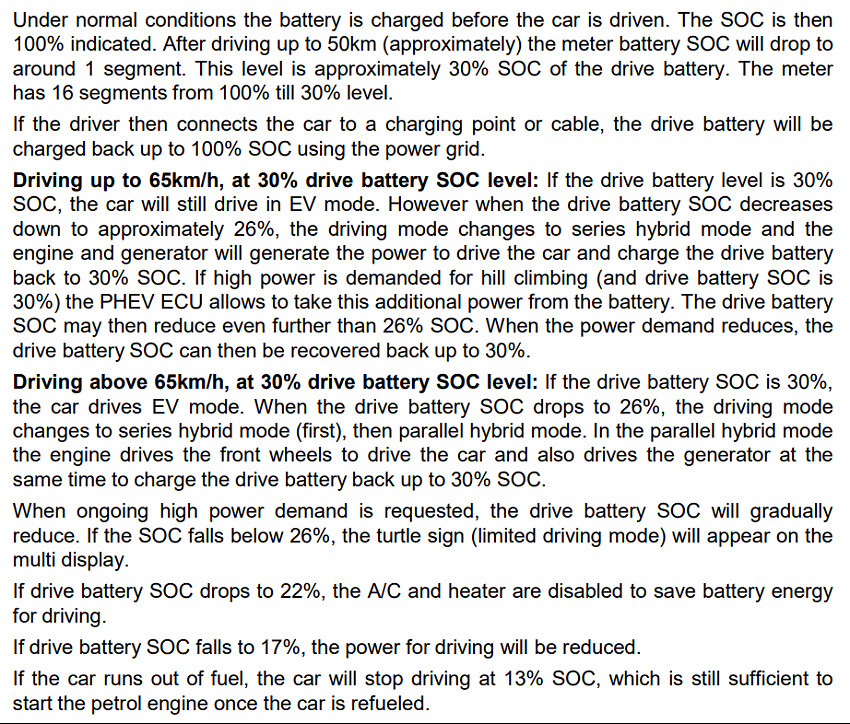
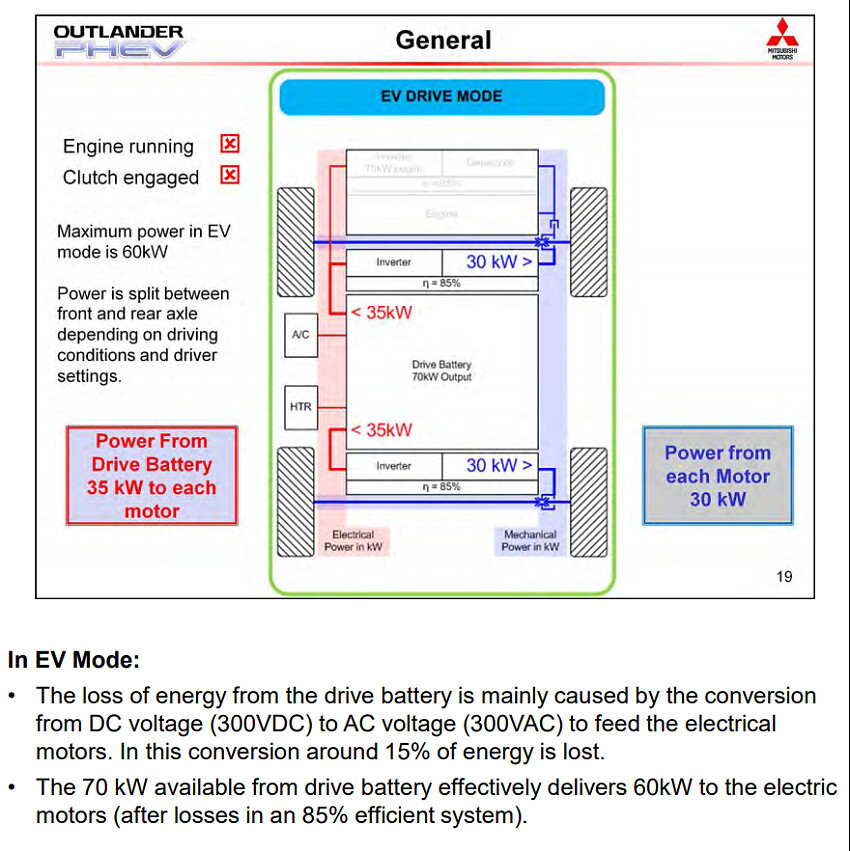
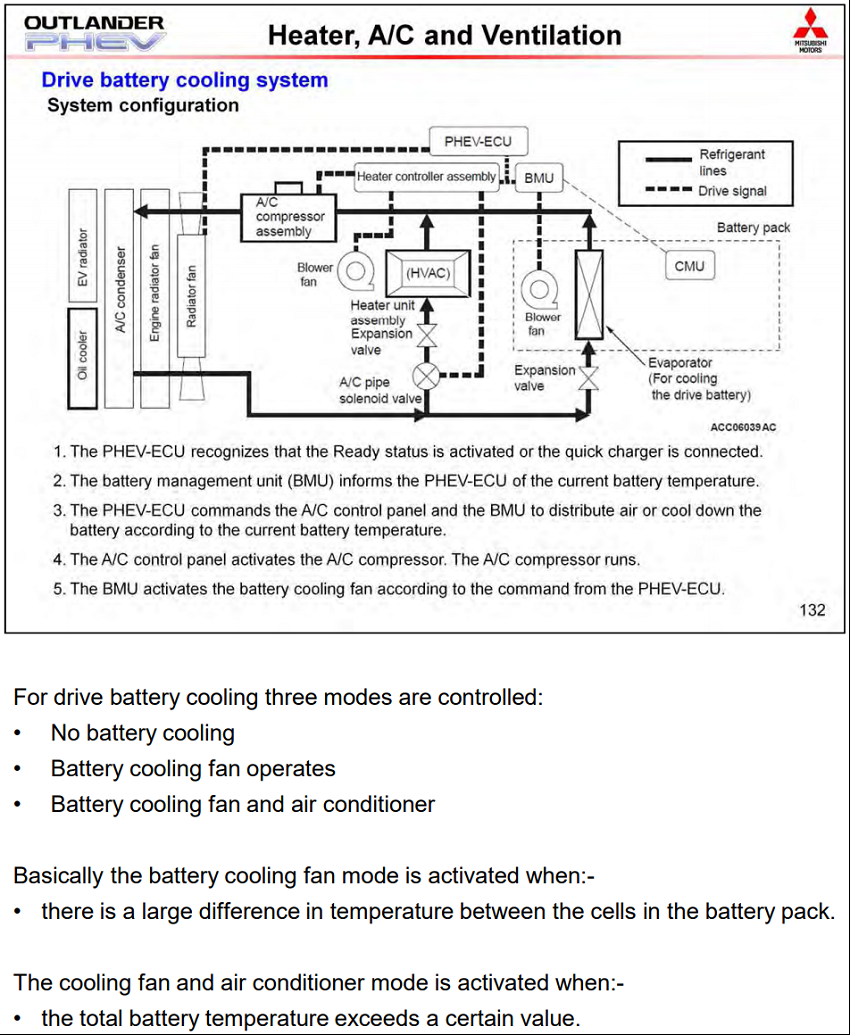
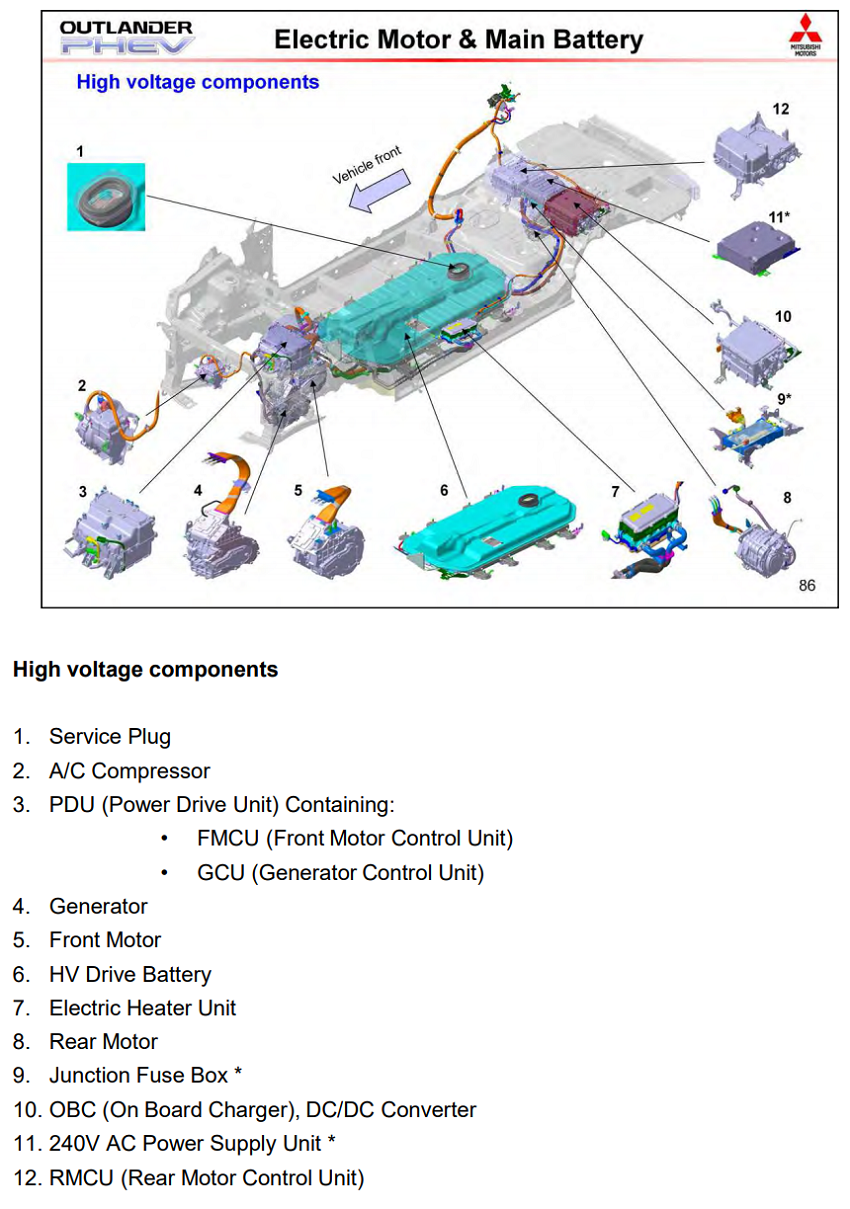
Image from MMC.
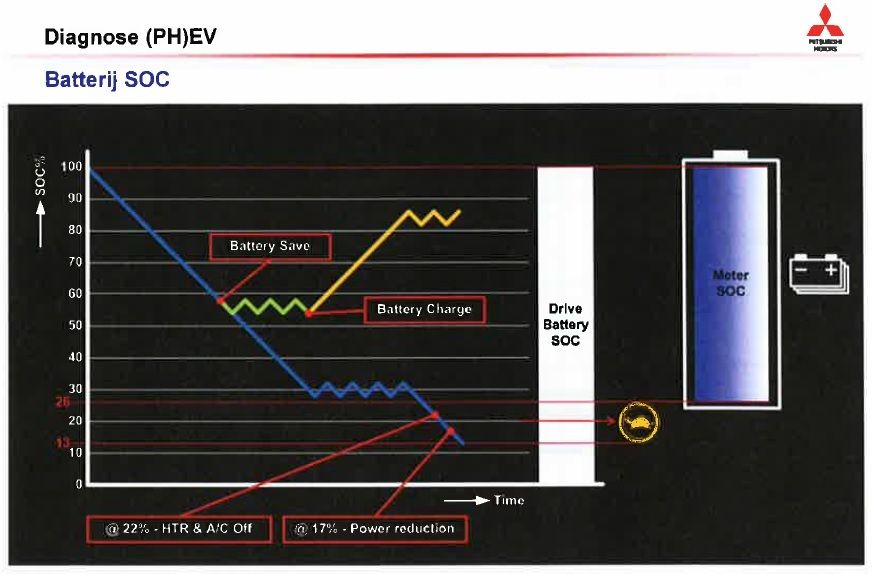
Note the sawtooth lines on the graph.
Regards Trex.
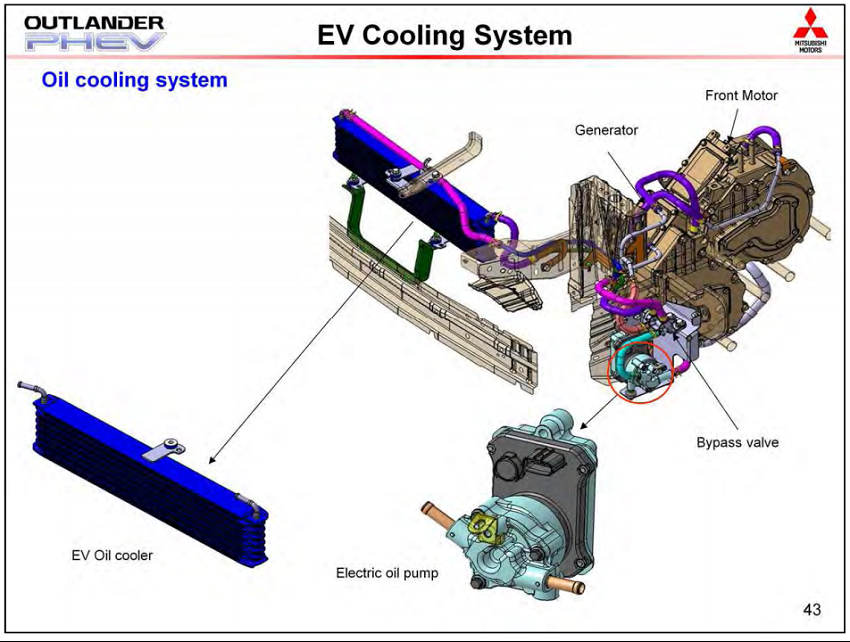
Hope this works so here goes.
Image from MMC.
Note the sawtooth lines on the graph.
Regards Trex.

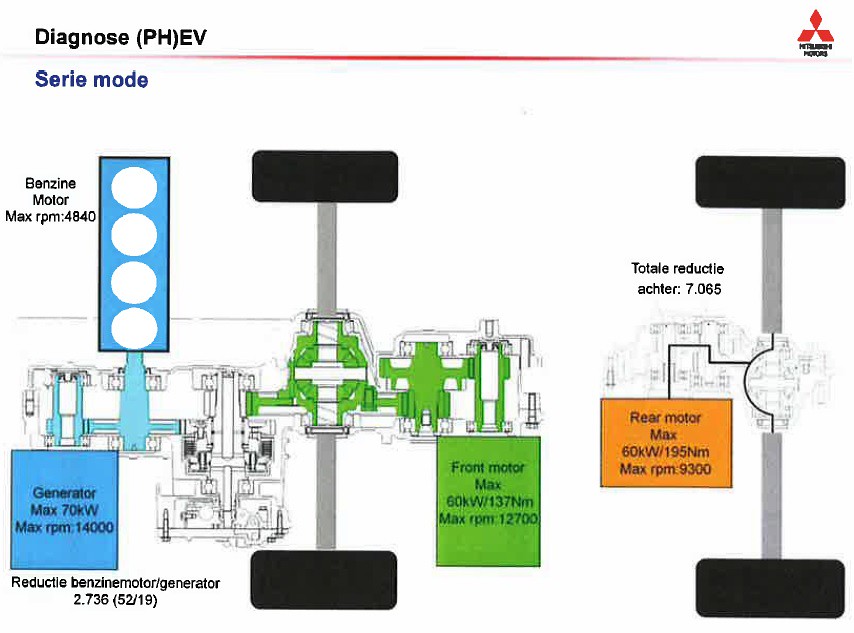
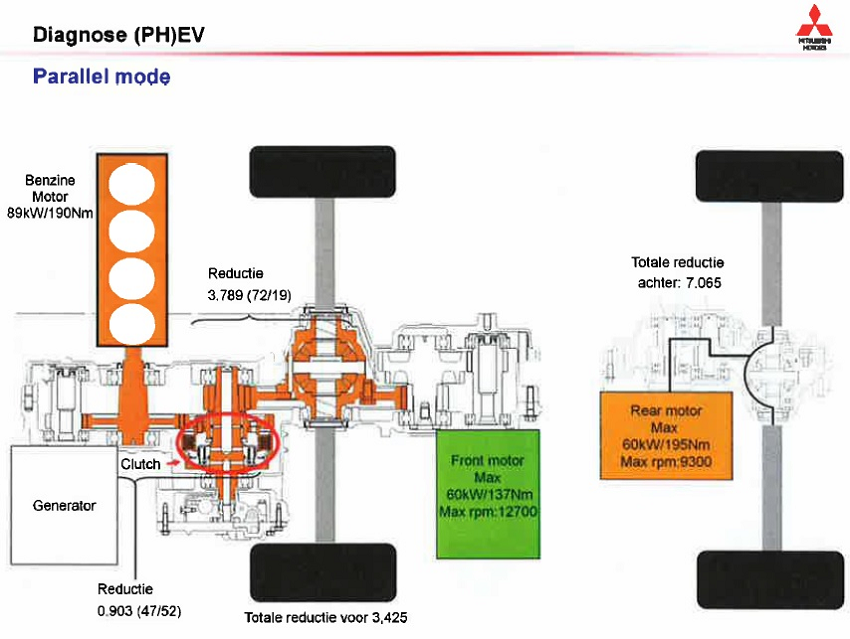
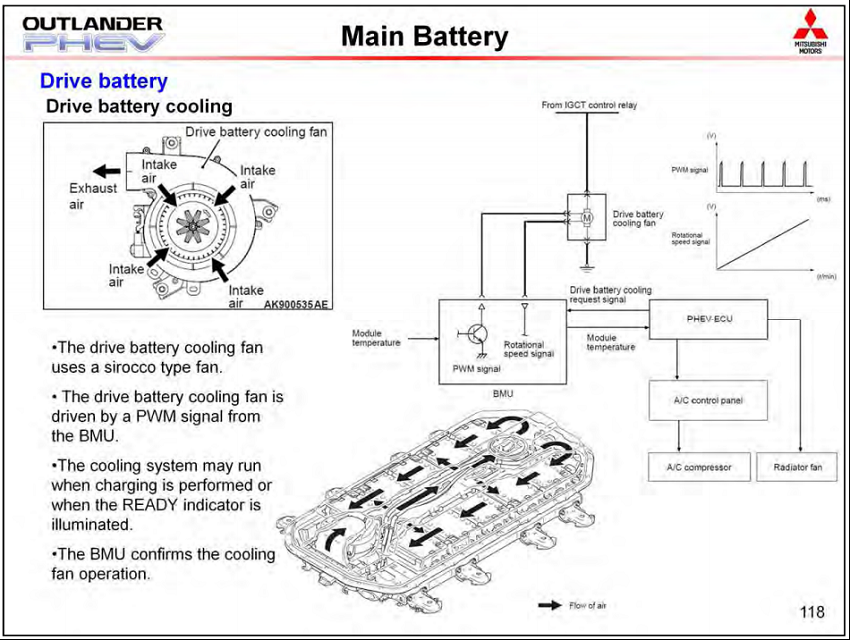
 Wow I did not know the generator and front electric motor go to such high rpms.
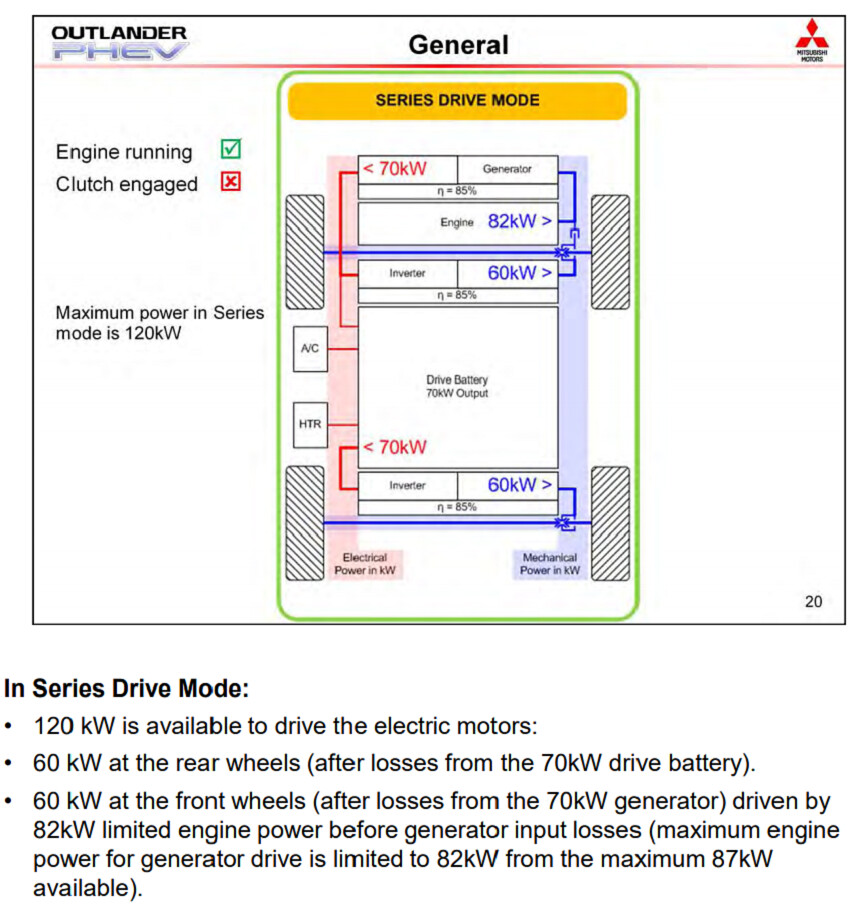
Trex said:Hi,
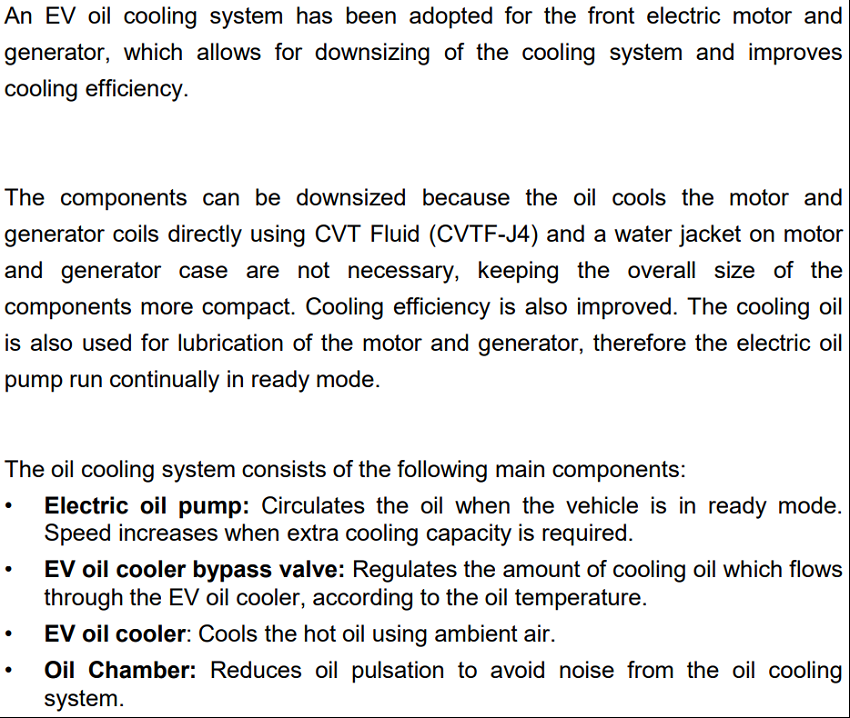
Hope this works so here goes and thanks to anko for permission.
I know anko has posted this before but I was hoping these will be placed in a sticky in the Technical discussions so it can be found easily for new members etc.
Note the sawtooth lines on the graph.
Regards Trex.
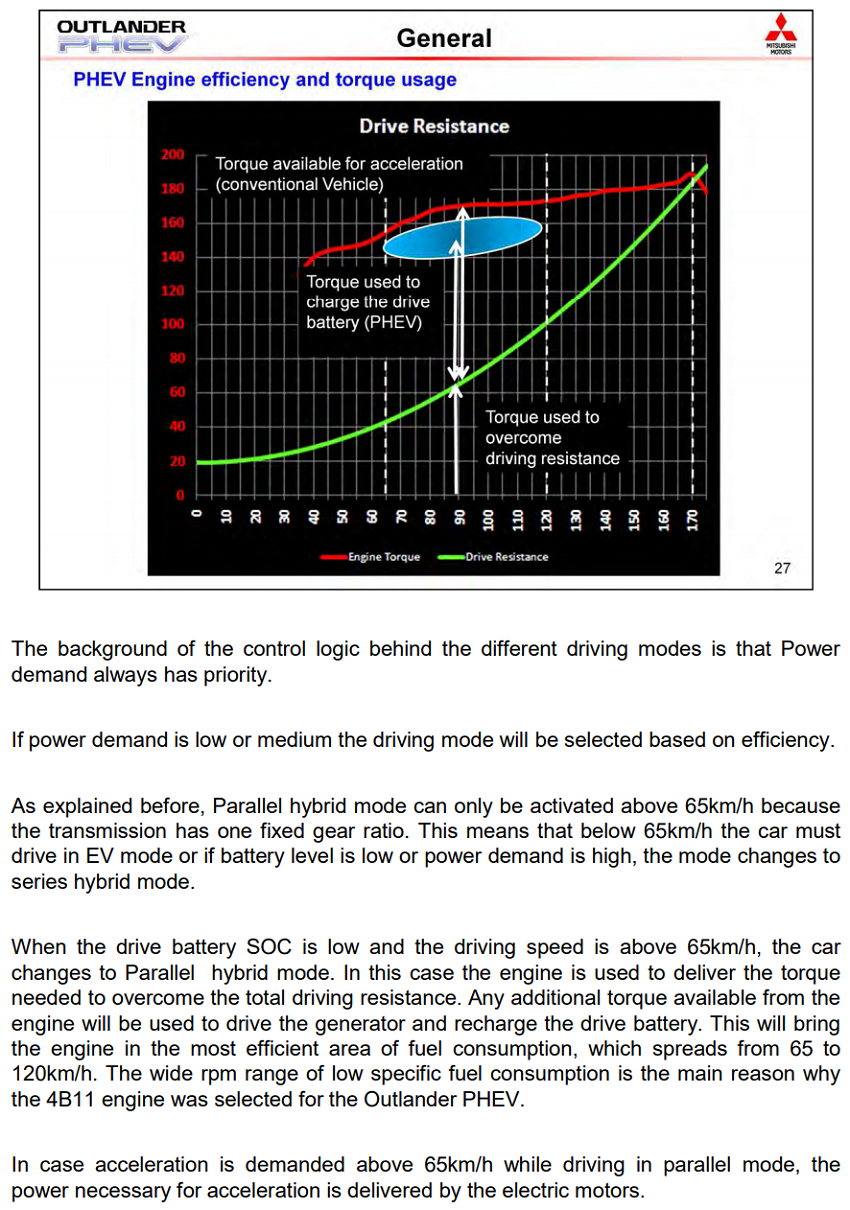
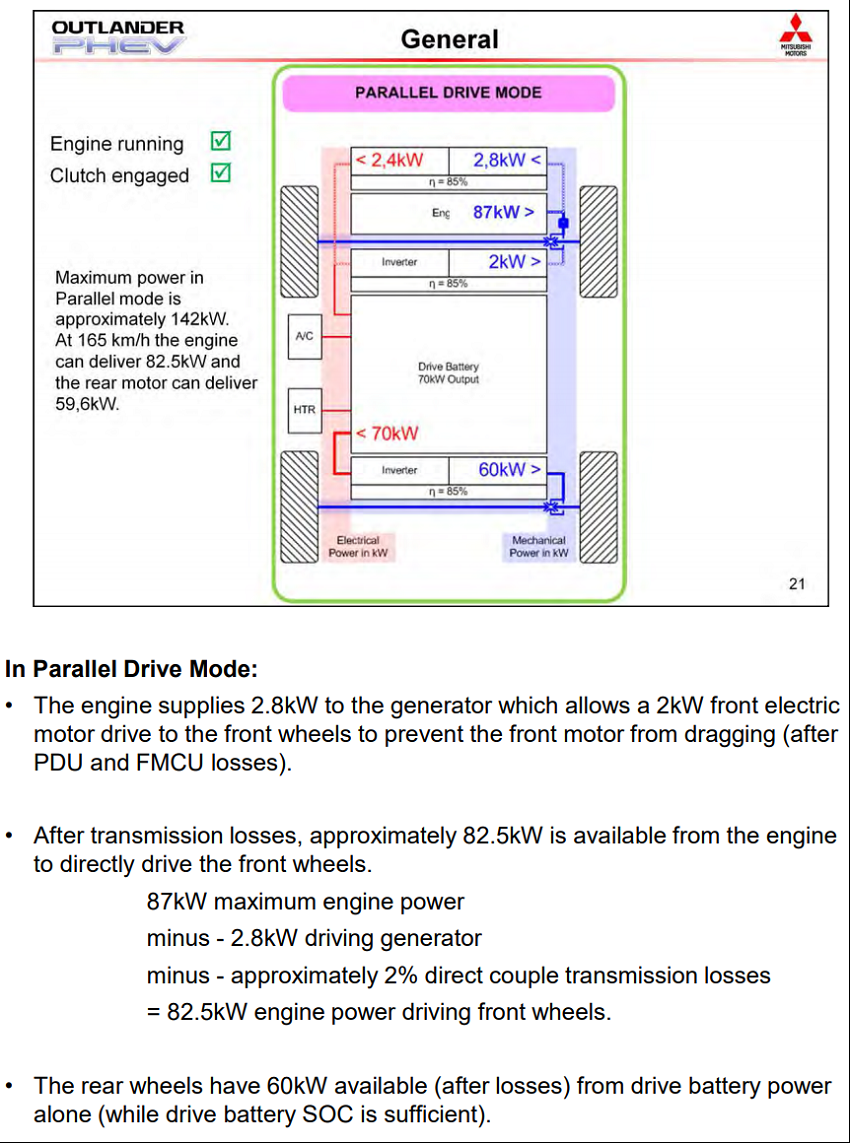
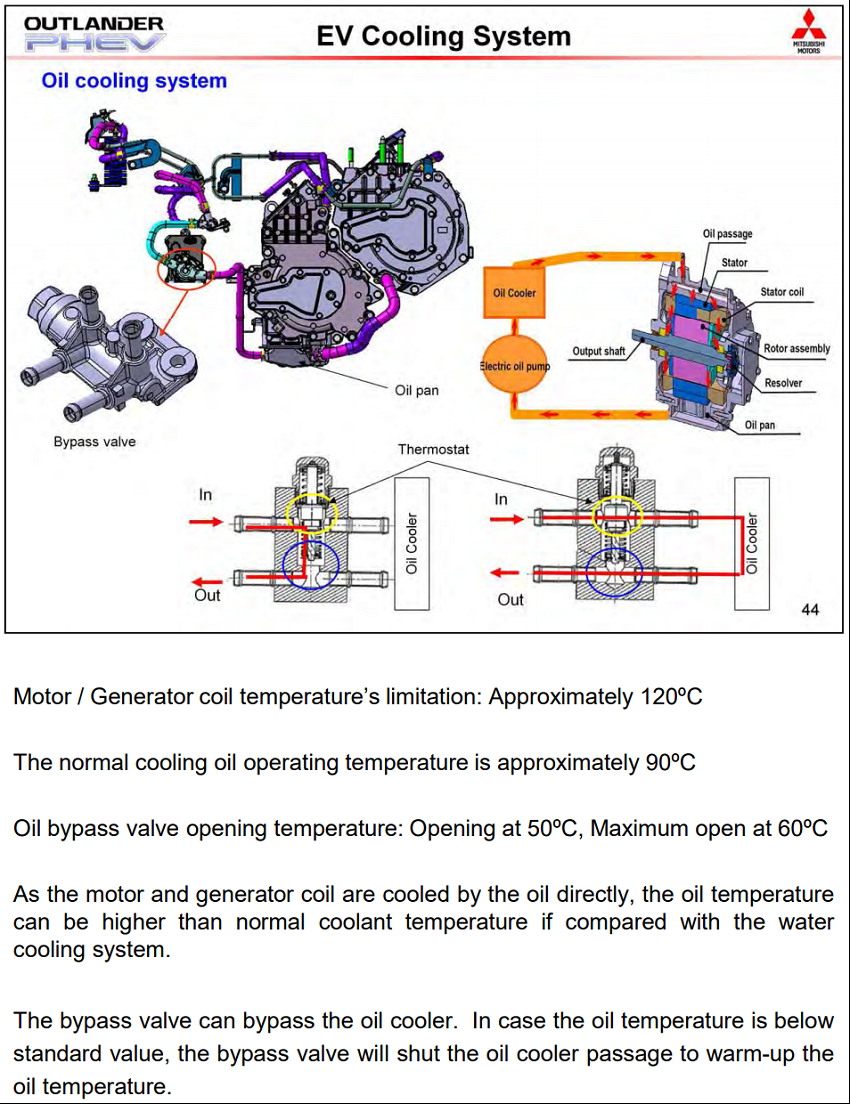
I suppose that by “Couple”, “Torque" is meantTrex said:Ok for people wanting to know the "sweetspot" for fuel consumption.
Text under this graph translated with onenote says:
"Above image (ei-diagram) shows an area (blue circle) where the 4B11 petrol engine the most efficient functions. This area is also called sweetspot called, here is the specific consumption is lowest. The green line shows the torque necessary to see the running resistance force to overcome the Red Iijn let the maximum torque see what the petrol engine can deliver. The area (couple) in between can be used to confirm the generator and power to make it exciting that the HV battery can be charged. This is of course only possible as at that time the engine torque is not necessary for the wheels, bv at constant drive. The generator function will instantly stop again as a couple for the wheels is requested. At 65 km/h running the motor about 1700 rpm is 155 Nm available this rises to 190 Nm at 4500 rpm and 170 km/h"
Regards Trex.
Material from anko
Enter your email address to join:
