anko
Well-known member
A lot has been said / speculated about what goes on when the engine is first started. How many RPMs? For how long? The blue arrow lights up intermittently, but is the battery charged in this phase? Etc. The left half of below picture gives us some more insight:
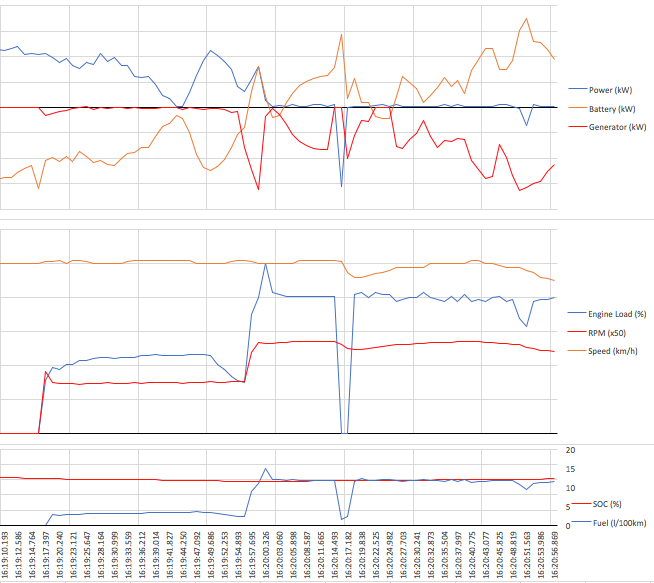
What does it tell us:
- There is about 40 seconds of low RPM (1500) before parallel drive is engaged.
- During this phase, fuel consumption is between 2.2 and 3.5 l/100km (or 2.2 and 3.5 l/h actually, since there is no relationship between engine behaviour and speed in this phase and I happened to be driving 100 km/h)
- Apart from a very small spike (dip) the generator does not absorb any mechanical power from the engine. So, no electricity is generated.
- When it all starts (16:19:16) there is a short spike of battery output (well, a dip but negative means output here) which is not met by a peak of E-motor output. I believe this spike must represent the power needed to start the engine. (You would expect to see a positive value for the generator trace (red line) because the generator is briefly producing mechanical output. But I could have easily missed it as OBD values are read once every 1.5 seconds and the peak should be very narrow. The dip in the battery trace is only one measurement wide.)
- Around 16:19:44, battery output is about 3.6 kW while generator and E-motors are doing noting. I think this is explained by losses plus power needed to eliminate E-drag in E-motors and generator.
Around 16:20:31, the generator absorb 5.2 kW of mechanical input. At that time, the E-motors output about 0.4 kW of mechanical output (most likely the rear one for the 4WD effect) and the battery accepts 1.8 kW of electrical input. The difference of 3.0 kW is most likely explained by losses and power needed to eliminate E-drag in the front motor.