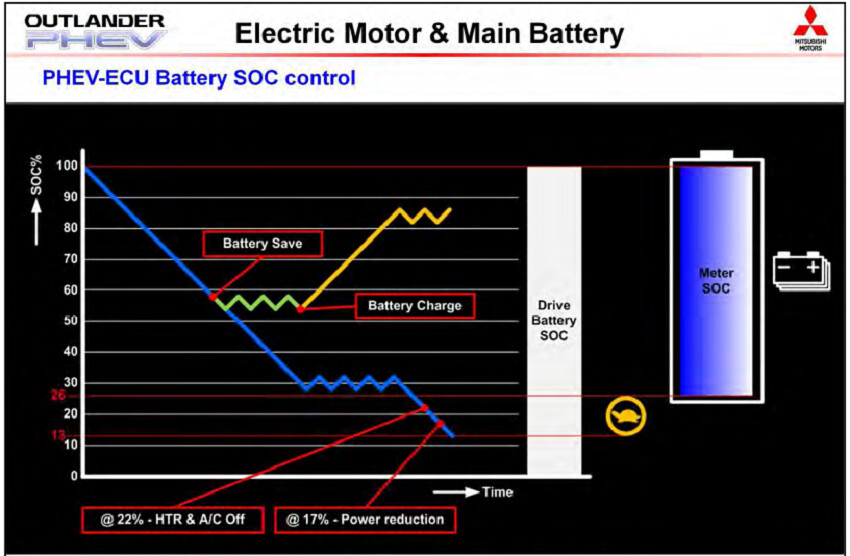
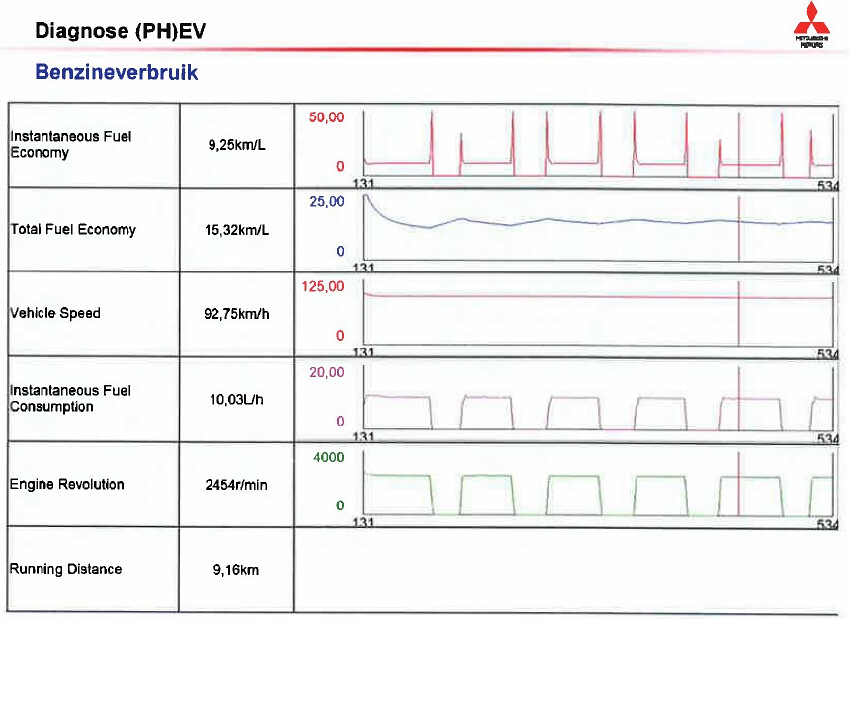
I think this is interesting because it shows our Phevs starting the petrol motor and charging the hv battery and then stopping petrol motor and going into ev mode, and then repeating, as we drive along in parallel mode speed. This is the sawtooth line showing on previous graph.
This test was done with a MUT-III at 1900kgs weight of the Phev.
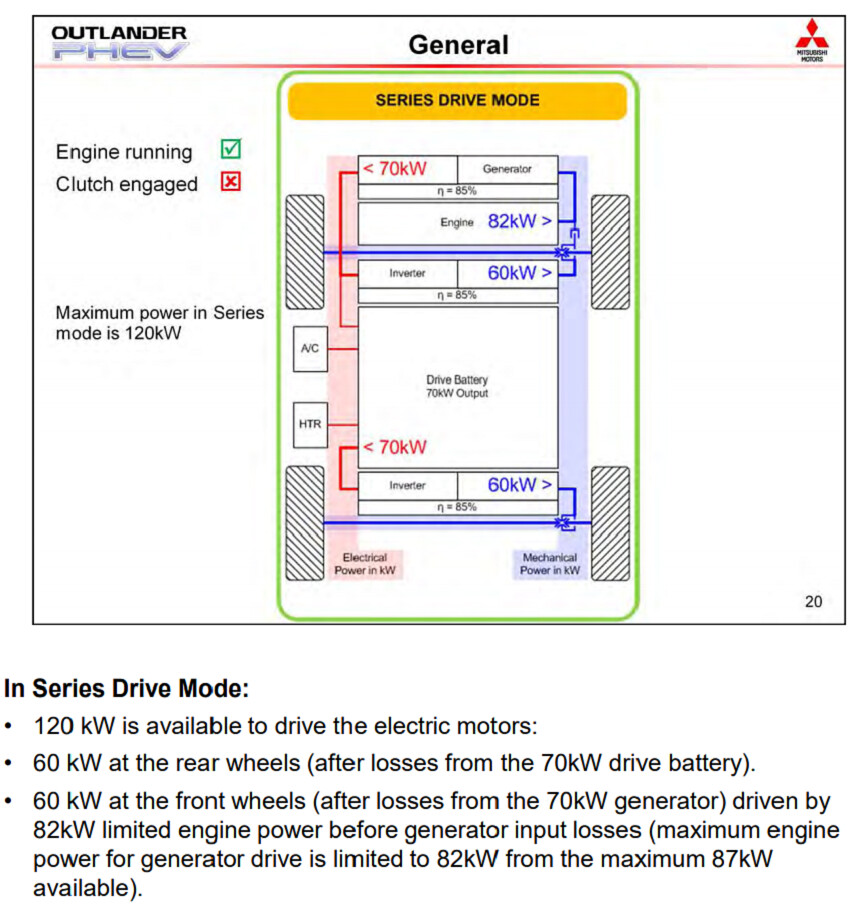
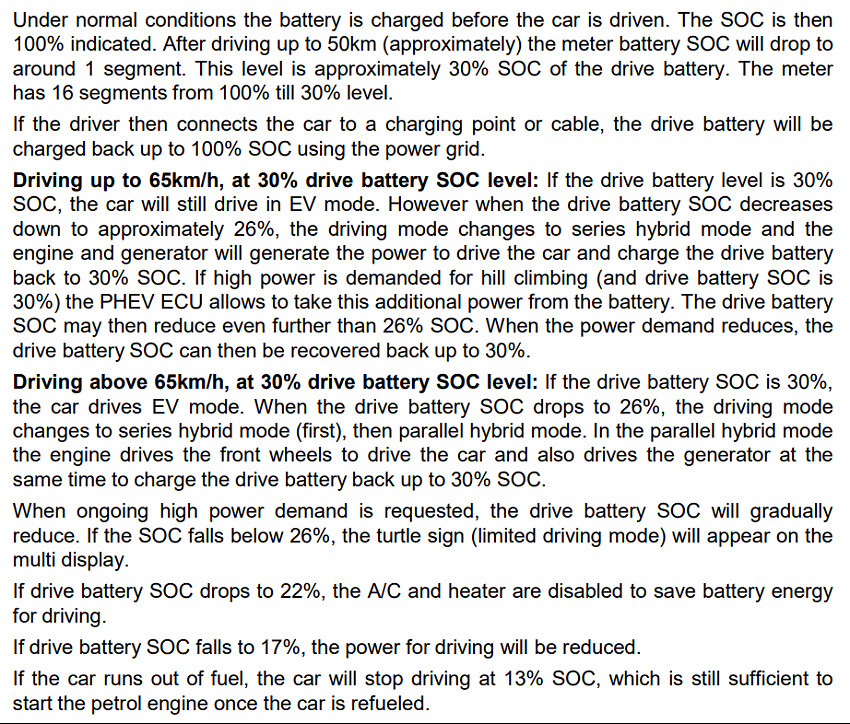
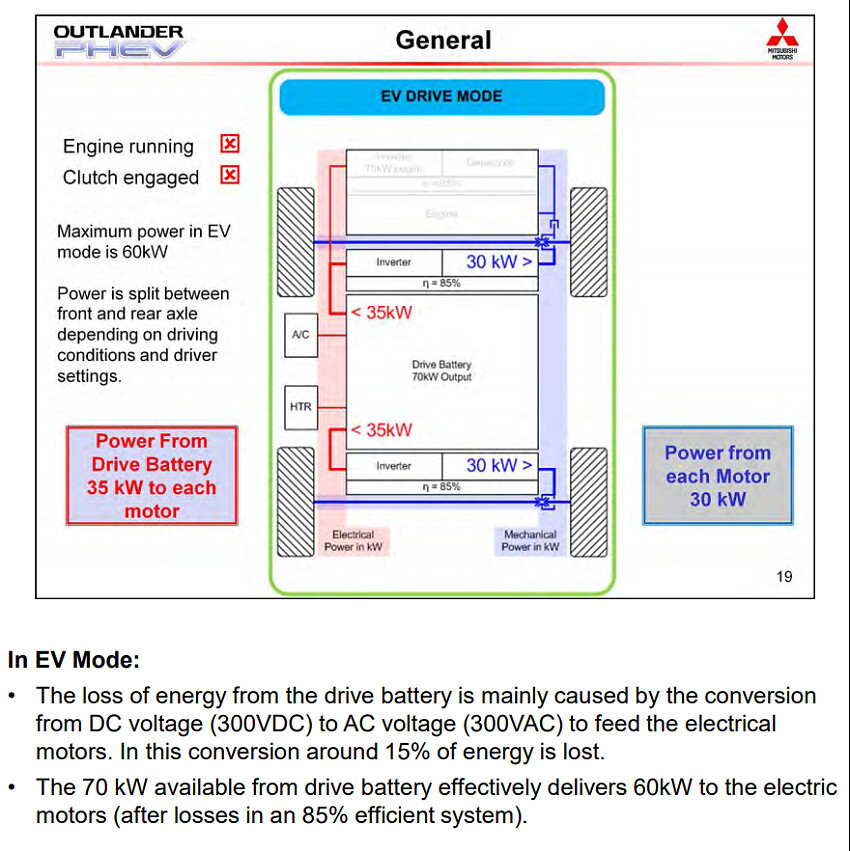
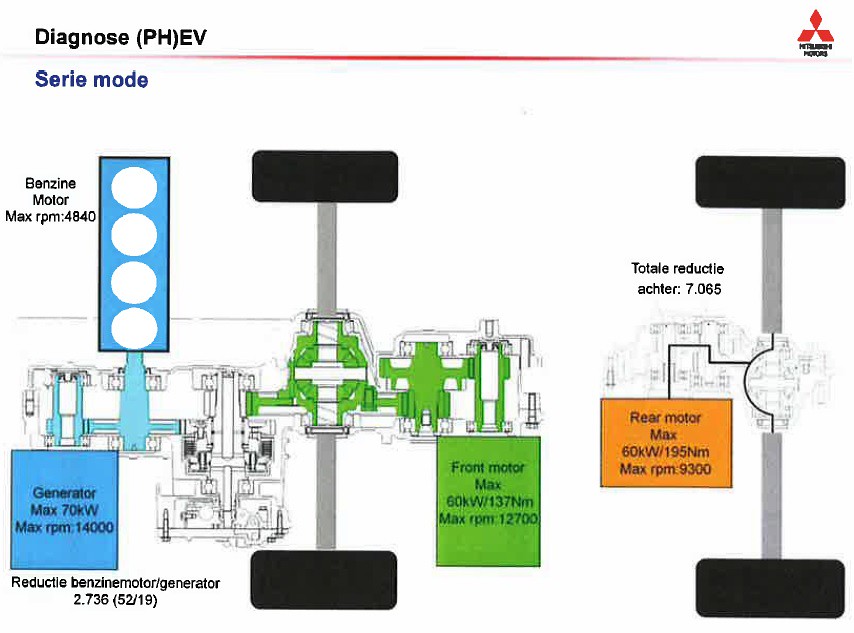
Series mode. Here 70kW from generator gets converted and which after losses give 60 kW to be split 30kW Front and Rear electric motors.
Add the 30kW split from the hv battery (see post above ie ev mode ) gives the Phev 60kW each for Front and Rear electric motors.
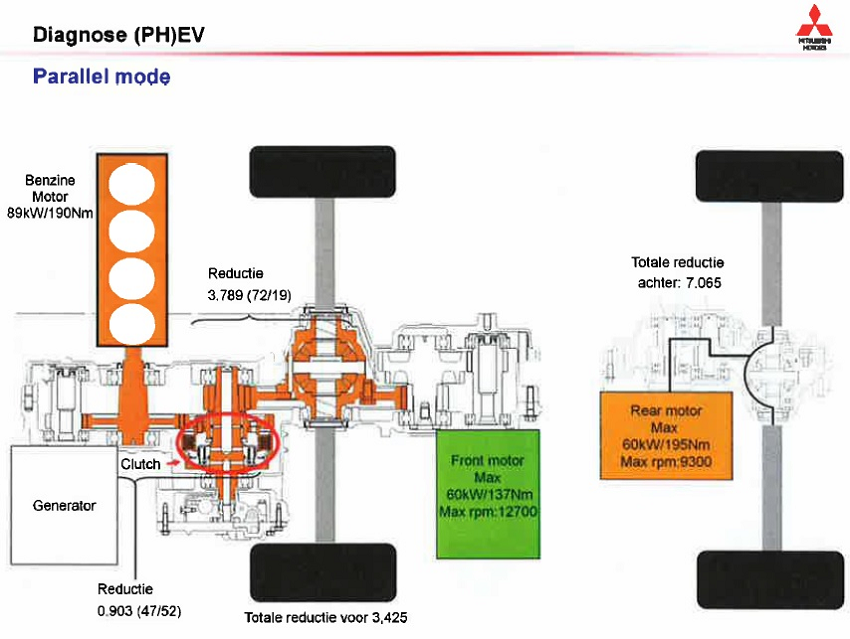
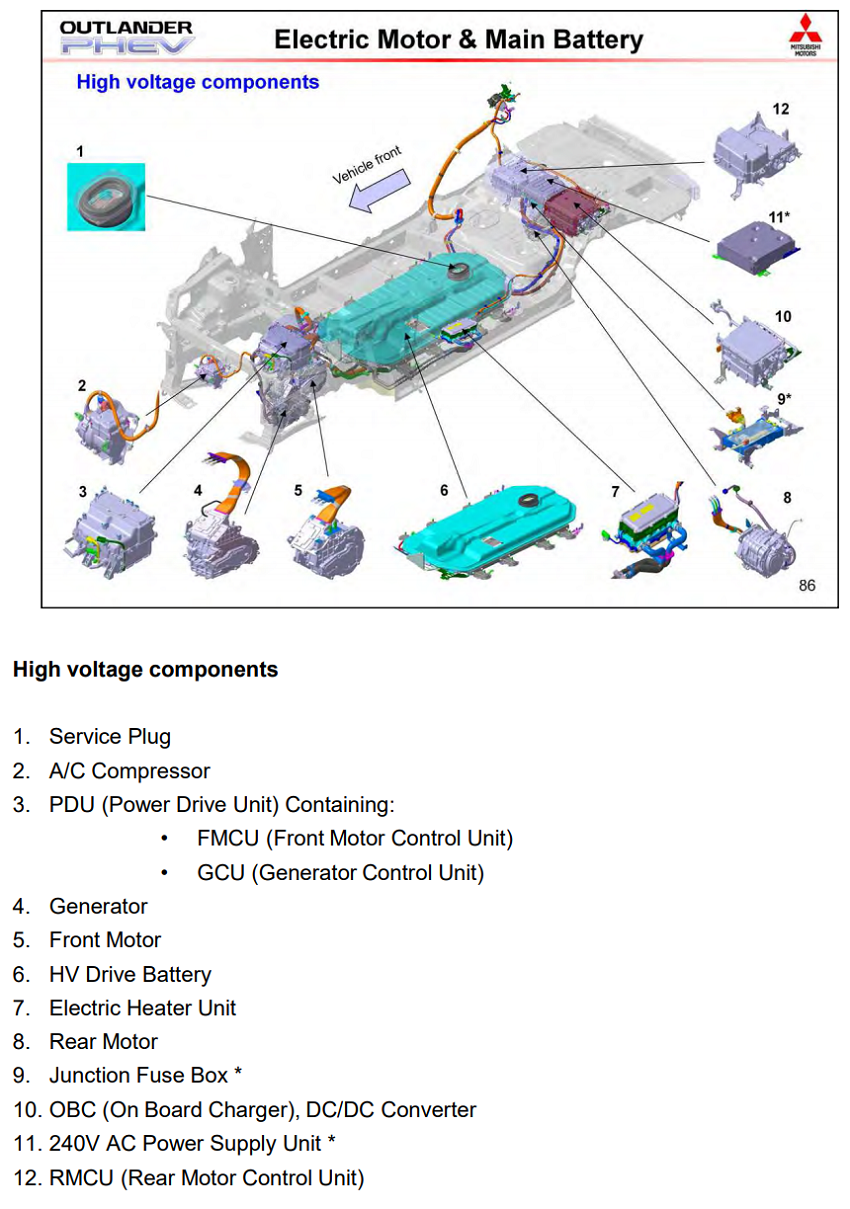
Wow I did not know the generator and front electric motor go to such high rpms.
Thank you for making it a sticky.I just hope it can help people especially new members like myself.
There are more images if members want I just do not know how complicated or technical the descriptions people want to see of the Phev. Is everybody seeing the images ok I hope I did not stuff up. :?
Again I want to thank anko for his permission and supplying of material
Hi,
Hope this works so here goes and thanks to anko for permission.
I know anko has posted this before but I was hoping these will be placed in a sticky in the Technical discussions so it can be found easily for new members etc.
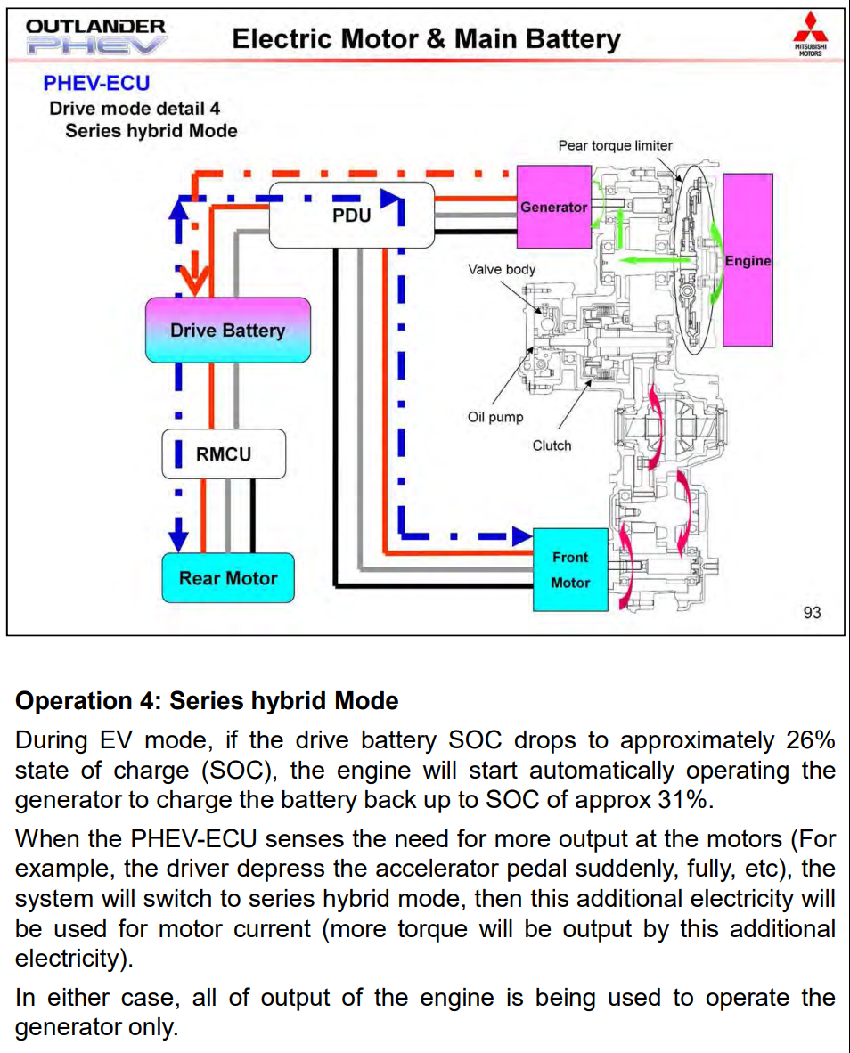
Wow, so the battery always keeps 30% in reserve! does that mean we are just a software rewrite away from adding 10miles to the outlanders standard EV range?
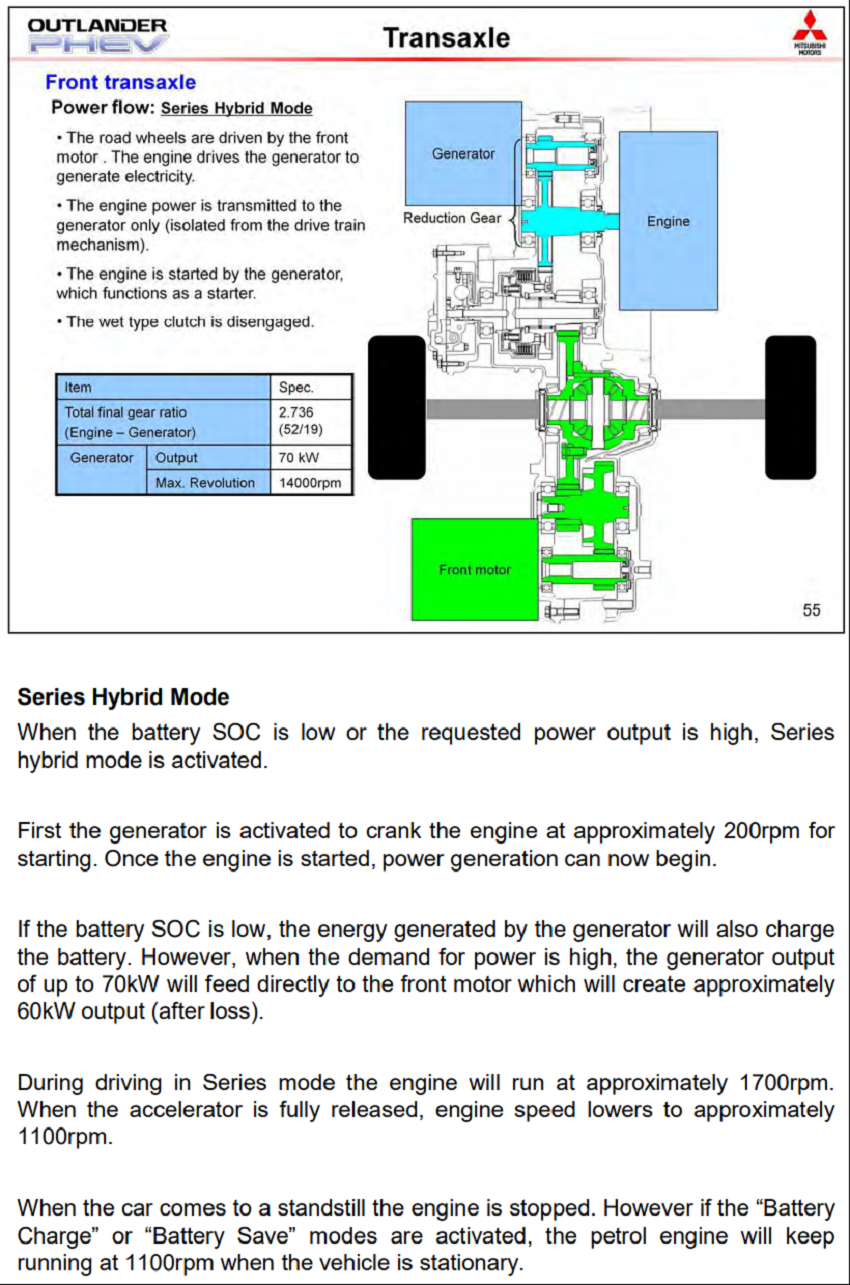
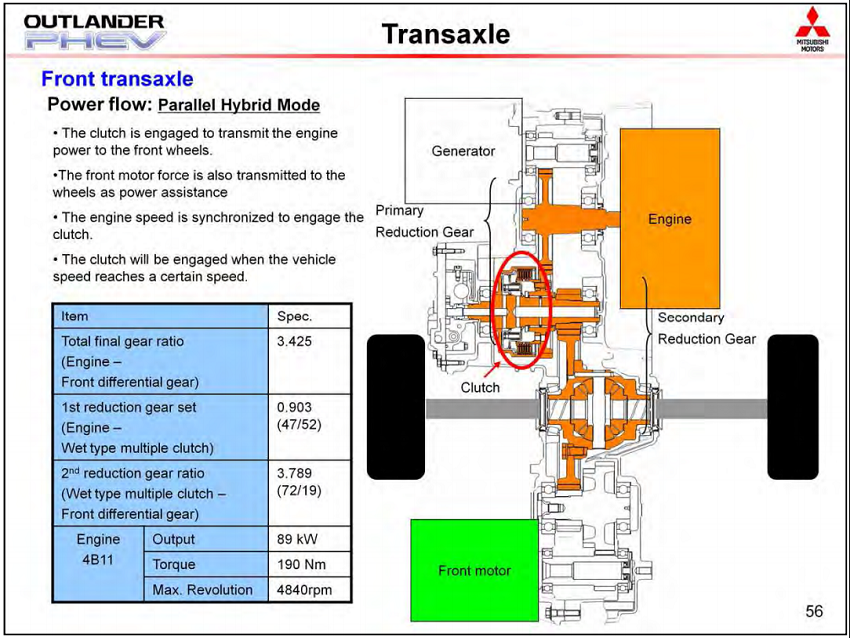
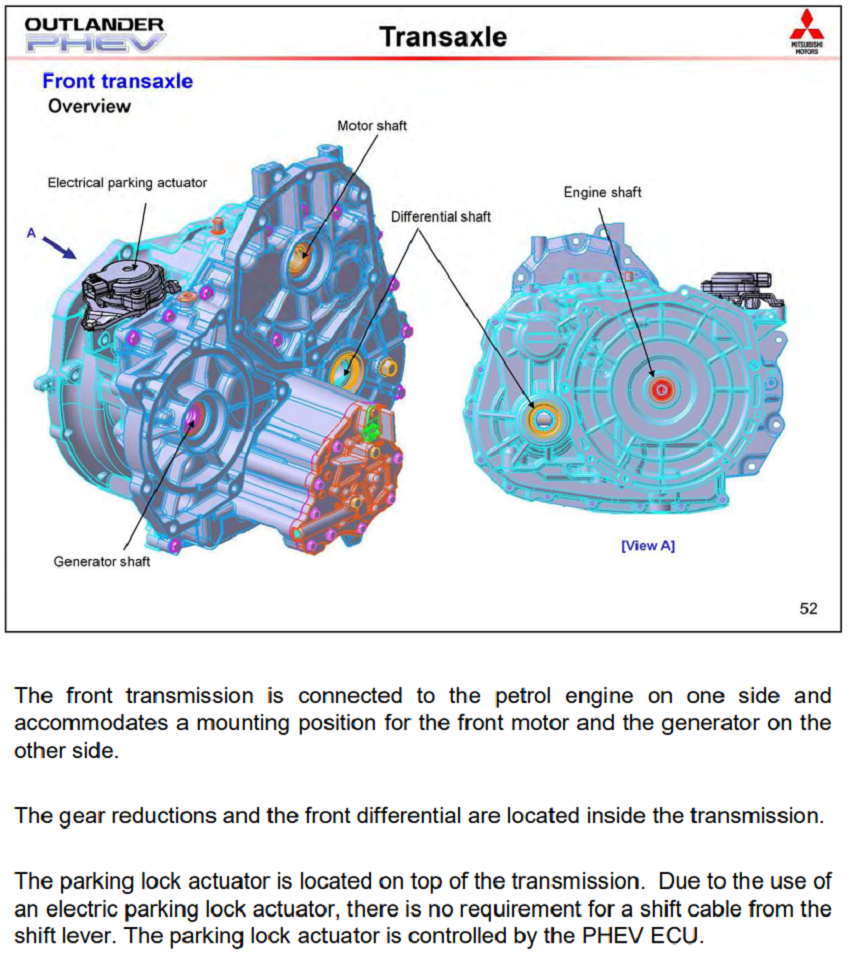
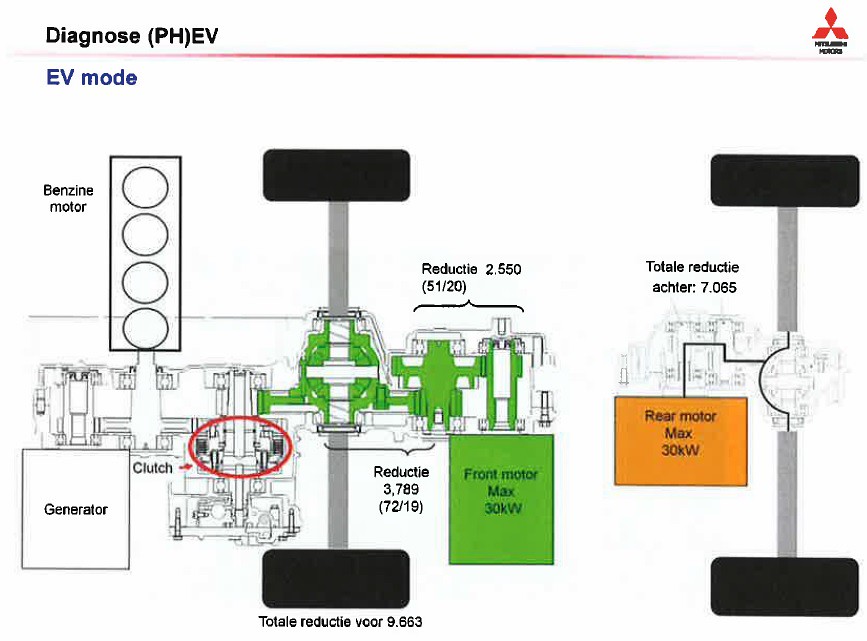
The transmission or transaxle that the petrol engine connects to.
Translation with onenote :
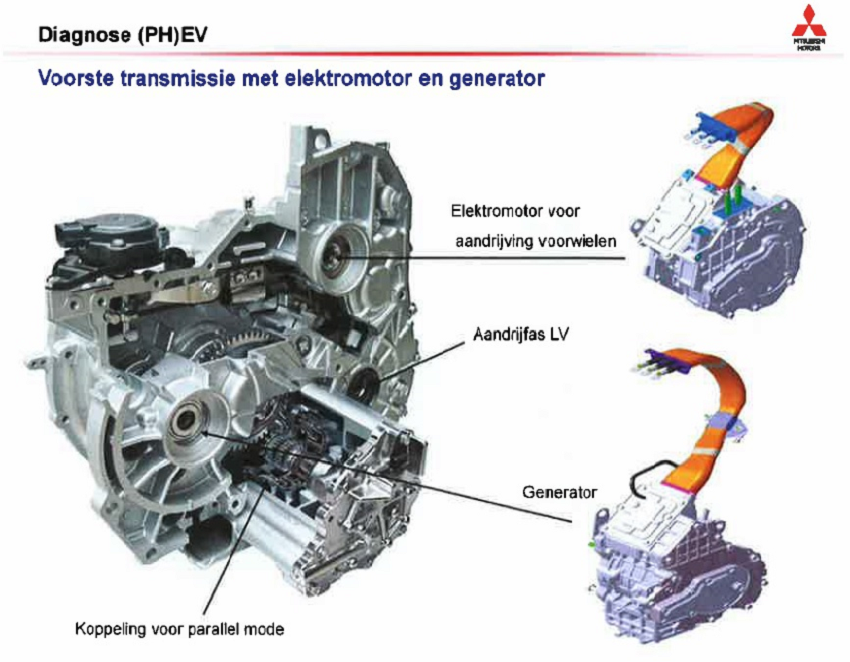
Voorste transmissie met elektromotor en generator : " Anterior transmission with electric motor and generator".
Elektromotor voor aandrijving voorwielen : "electric motor for front wheels drive".
Aandrijfas LV : " drive shaft LV". This goes to front wheels axle.
Koppeling voor parallel mode : " coupling (or clutch) for parallel mode " .
The petrol motor connects from behind in this image.
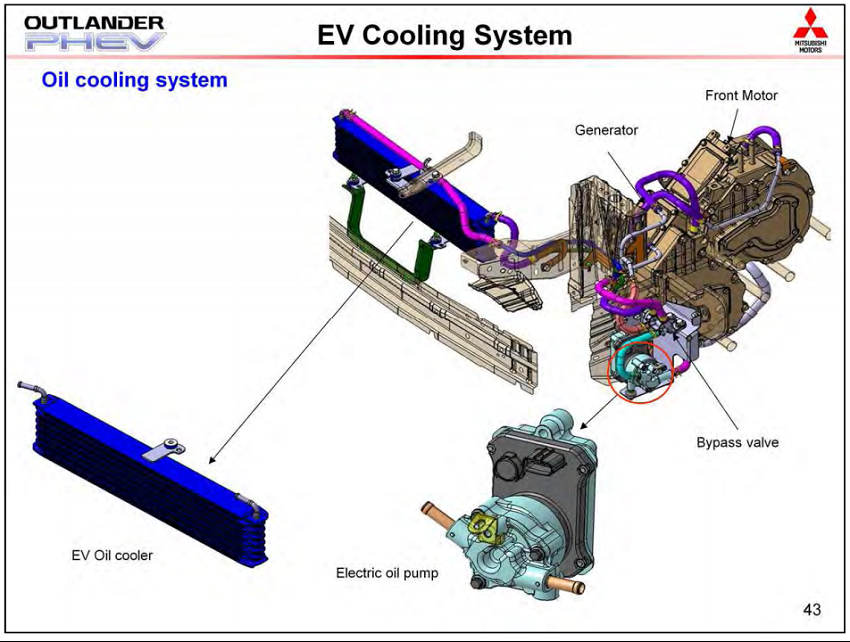
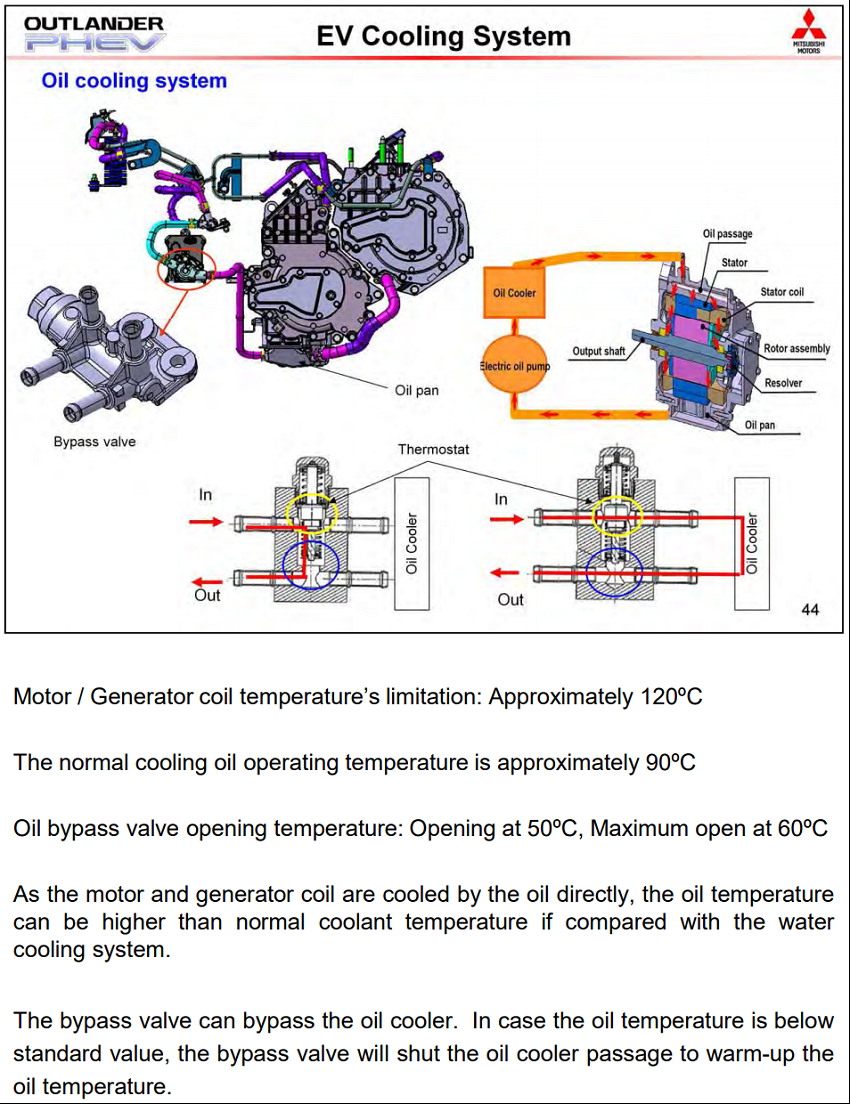
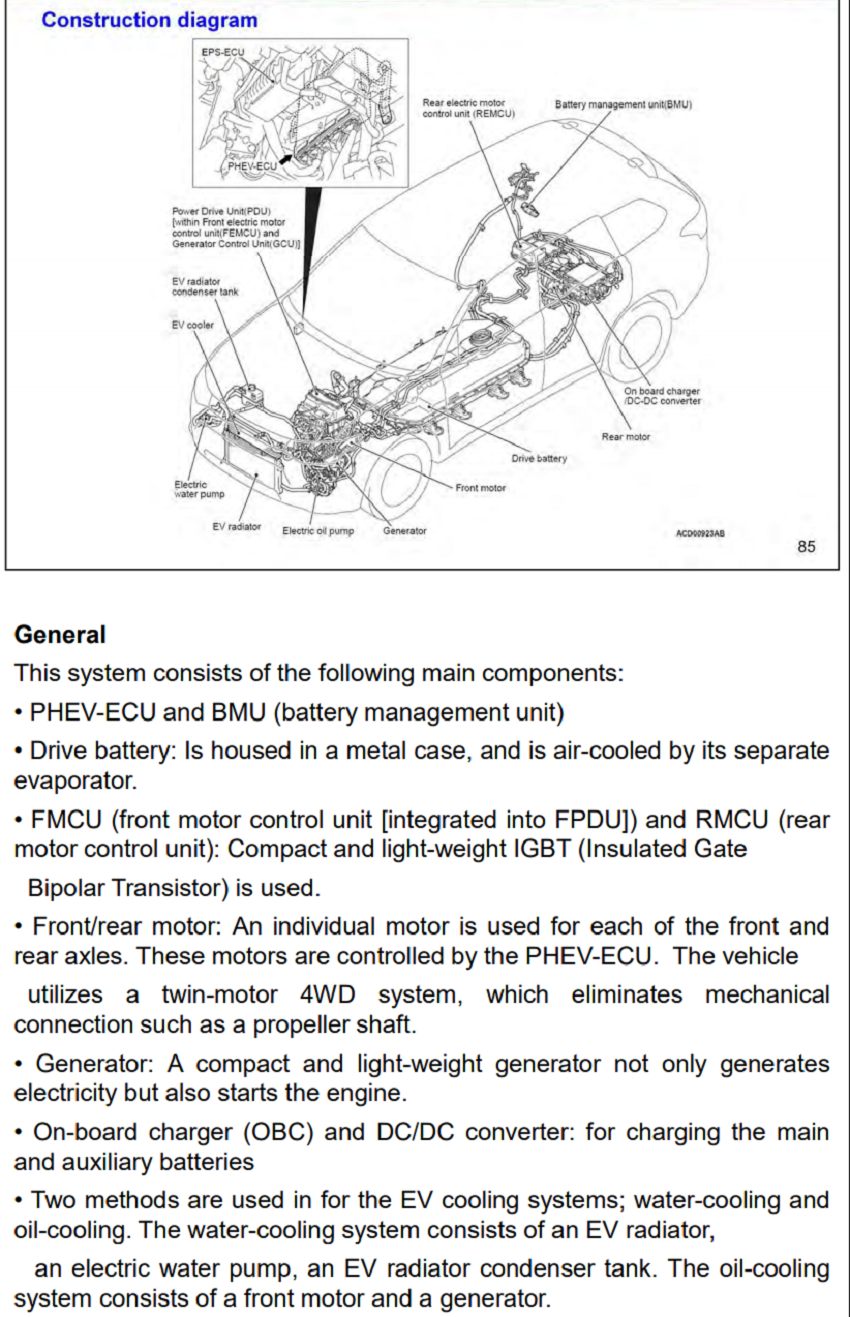
Image from MMC via anko.
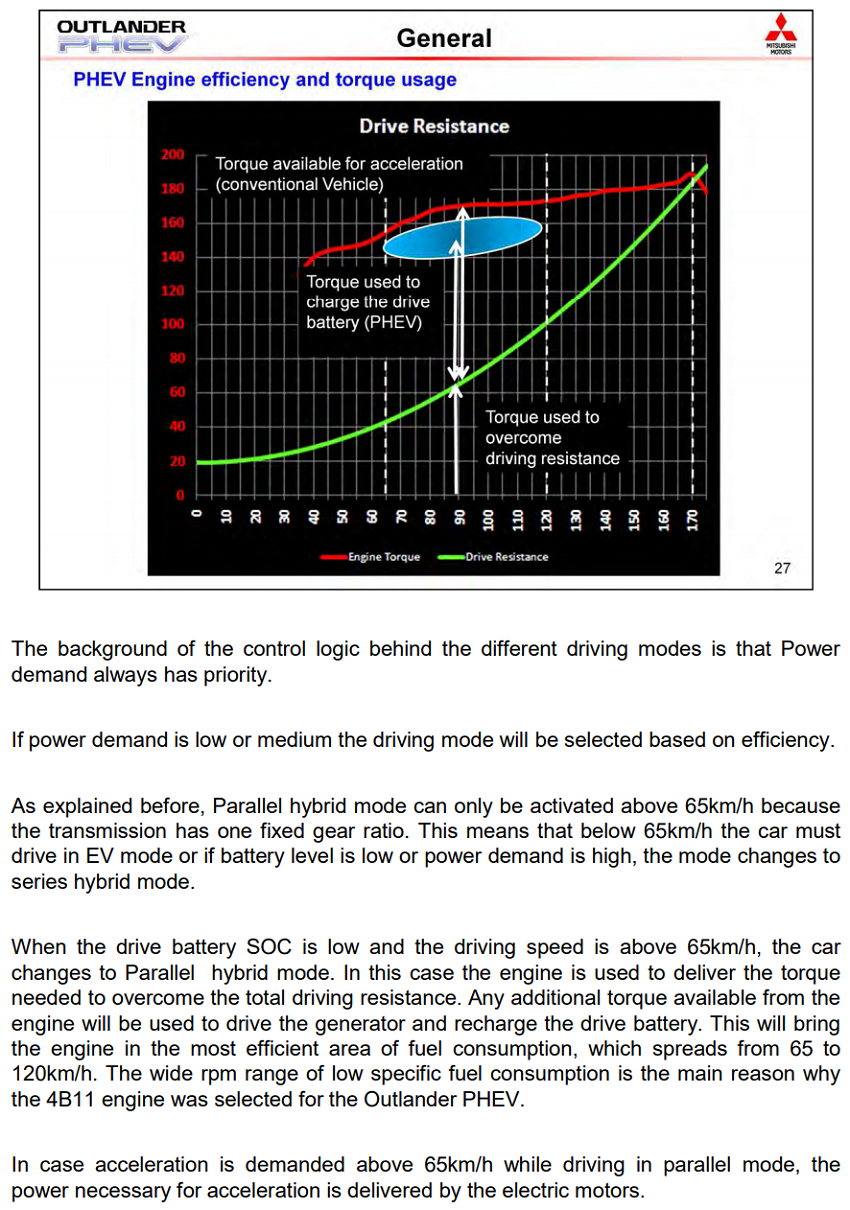
Ok for people wanting to know the "sweetspot" for fuel consumption.
Text under this graph translated with onenote says:
"Above image (ei-diagram) shows an area (blue circle) where the 4B11 petrol engine the most efficient functions. This area is also called sweetspot called, here is the specific consumption is lowest. The green line shows the torque necessary to see the running resistance force to overcome the Red Iijn let the maximum torque see what the petrol engine can deliver. The area (couple) in between can be used to confirm the generator and power to make it exciting that the HV battery can be charged. This is of course only possible as at that time the engine torque is not necessary for the wheels, bv at constant drive. The generator function will instantly stop again as a couple for the wheels is requested. At 65 km/h running the motor about 1700 rpm is 155 Nm available this rises to 190 Nm at 4500 rpm and 170 km/h"

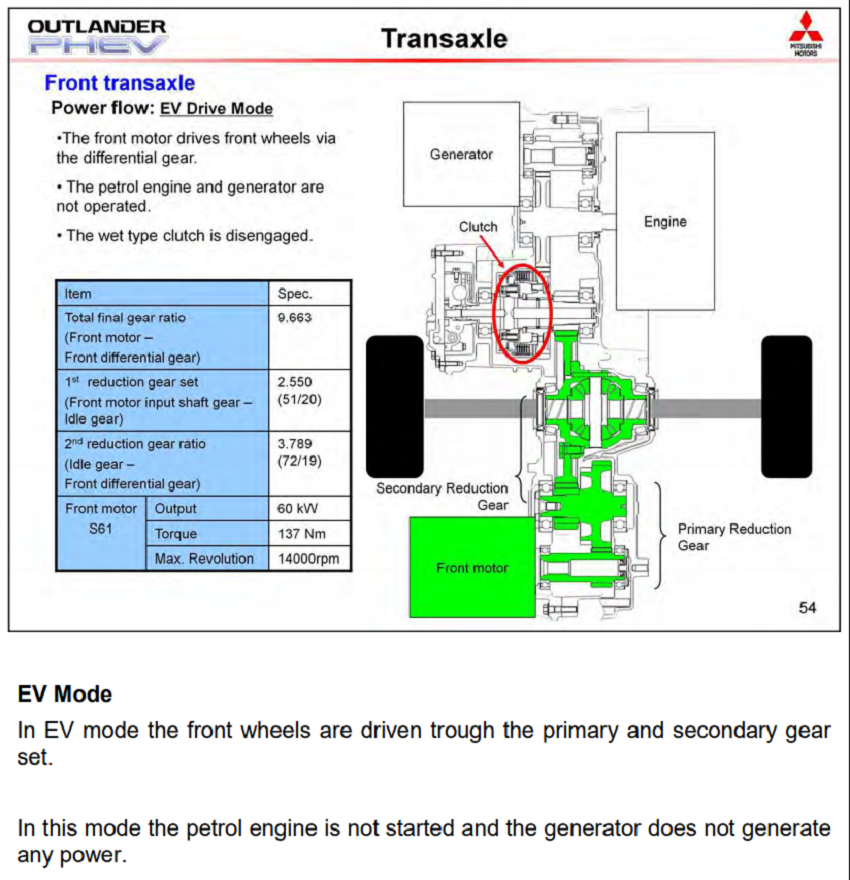
 Wow I did not know the generator and front electric motor go to such high rpms.